
The Class of 2029 navigated the most competitive admissions cycle in Duke’s history. For the first time ever, the University’s overall acceptance rate fell below 5%, driven by record selectivity in both Early Decision and Regular Decision application cycles.
Landing a spot meant standing out amid a record-high number of total applicants.
To put this year's striking figures in context, The Chronicle reviewed Duke’s admission announcements since 2000 to trace the steep climb in applications and steady decline in acceptance rates.
The Chronicle compiled a dataset of Early Decision, Regular Decision and full-cycle admission figures from the 2000-01 to 2024-25 application cycles. Figures were taken primarily from Chronicle articles and corroborated with Duke Today announcements. In the event that numbers conflicted across the two sources, The Chronicle’s value was used, as the newspaper independently calculated and verified these figures.
The complete methodology and limitations of the analysis are provided below.
Declining acceptance rates
Since the start of the 21st century, Duke’s acceptance rates have declined across all three application categories — Regular Decision, Early Decision and overall admission rates. At the turn of the millennium, the University had an overall acceptance rate of roughly 25%, which has since plunged to below 5%.

While the declines were relatively steady across the three categories, the Early Decision admission rate saw the most variation.
Notably, the largest increase in acceptance rate occurred in the 2006-07 application cycle, with Duke receiving fewer applications than in the previous year, likely in response to the lacrosse scandal that made national headlines in March 2006.
The event marked a setback for the University’s public reputation, although the claims at the core of the scandal were deemed unfounded — and recently admitted to be fabricated. Per The Chronicle’s analysis, Early Decision was hit particularly hard in this application cycle, making it the least selective cycle in the analysis period with Duke accepting a record-high 39.1% students.
Duke has historically admitted Early Decision applicants at a much higher rate than Regular Decision applicants.
Because the University admits far more Regular Decision students than Early Decision students — between 69% and 89% of yearly admitted students are Regular Decision during the analysis period, compared to 11% and 31% for Early Decision — the overall acceptance rate closely resembles the Regular Decision rate.
More applications
Nearly every application cycle in The Chronicle’s analysis period experienced an increase in the number of applications. The all-time high came this past year, with the University receiving 6,627 Early Decision applications, 51,984 Regular Decision and 58,611 overall.
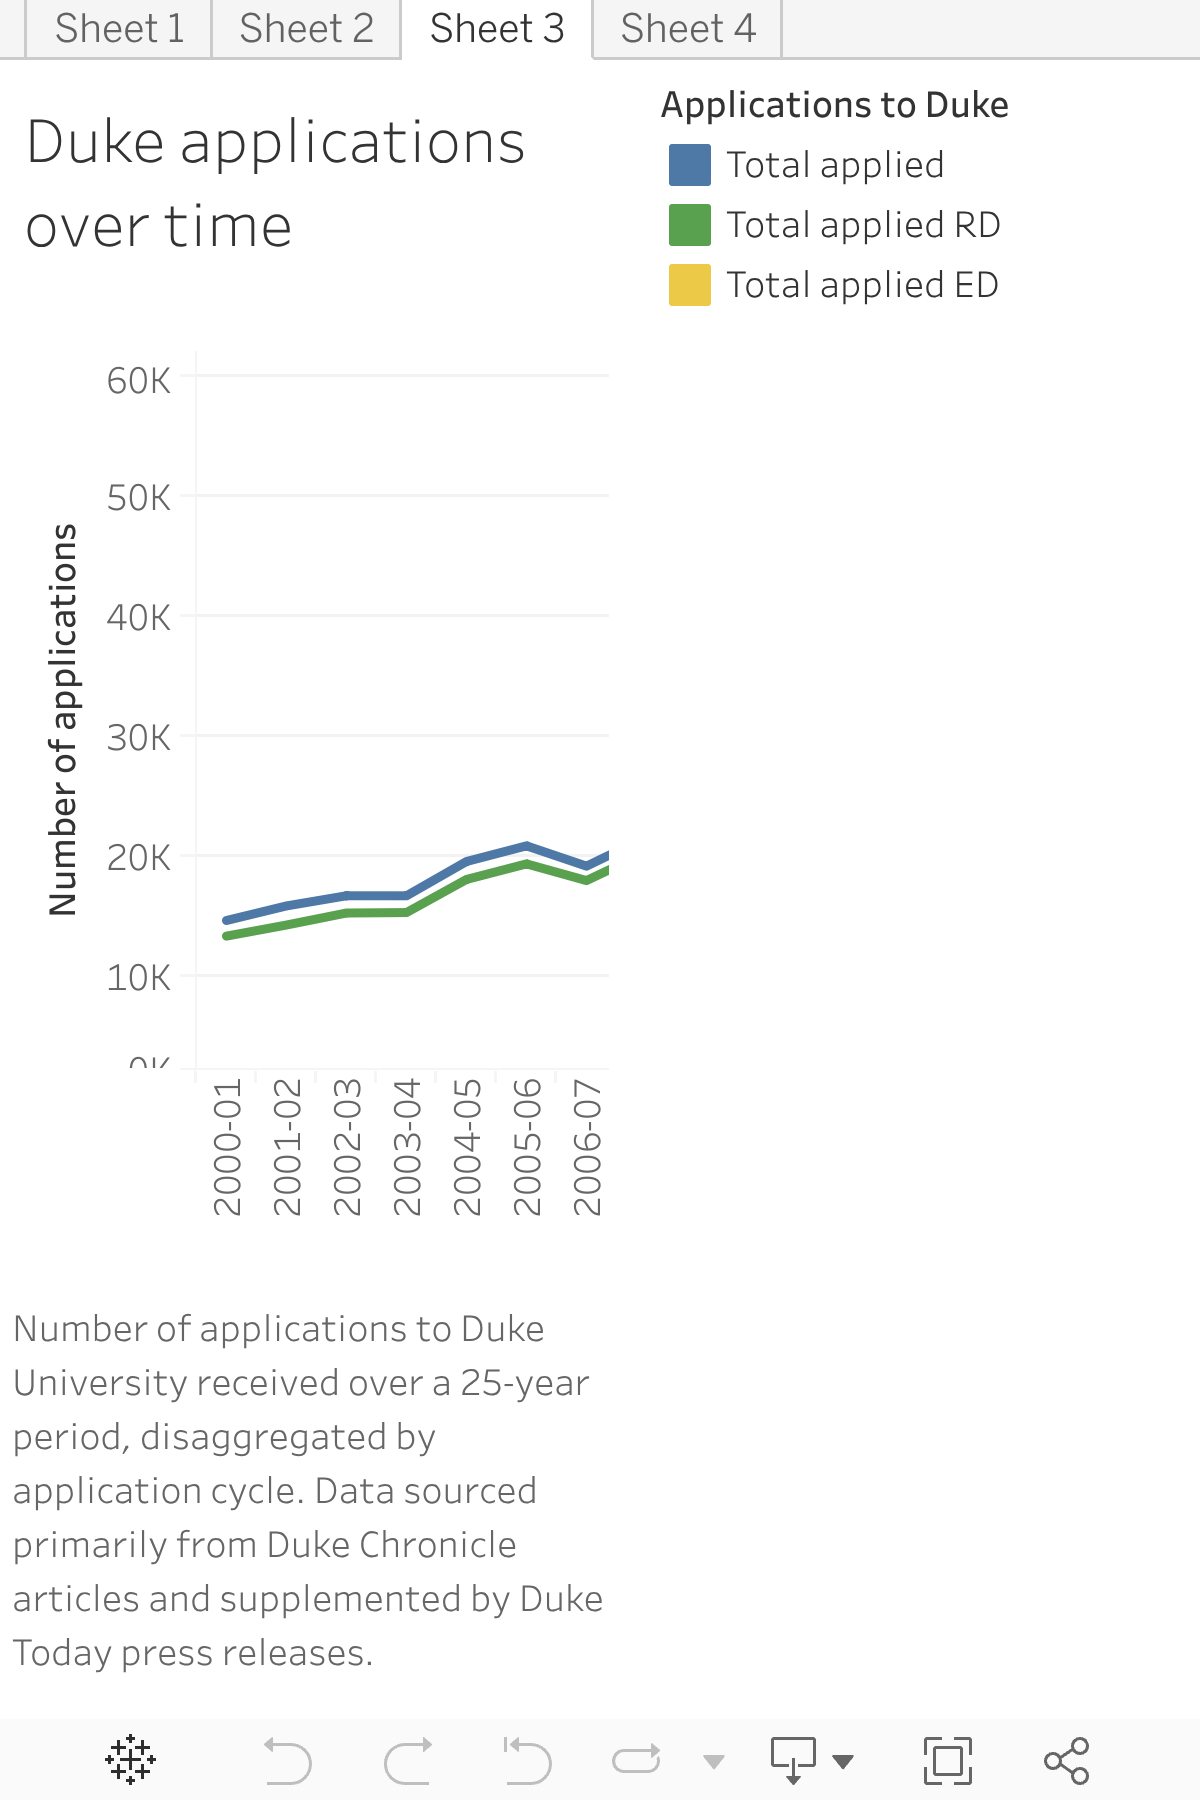
Just six out of the total 25 years saw a drop in Early Decision applications compared to the year before. For Regular Decision, that number was four, and for the overall admission cycle, it was five.
2006-07 saw the fewest Early Decision applications, though Duke did not report an exact figure this year (see “Methods and limitations” for more information). 2000-01 saw the lowest number of Regular Decision and total applicants of the analysis period.
The University experienced a notable dip in applications during the 2019-20 cycle, likely due to the onset of the COVID-19 pandemic, but applications quickly bounced back in the next cycle.
More Early Decision admits, fewer Regular Decision
Get The Chronicle straight to your inbox
Sign up for our weekly newsletter. Cancel at any time.
Since 2008, the University has generally lowered the number of students it accepts Regular Decision while generally increasing the quantity it accepts Early Decision. In the most recent cycle, Duke admitted 1,953 Regular Decision applicants and 849 Early Decision applicants.
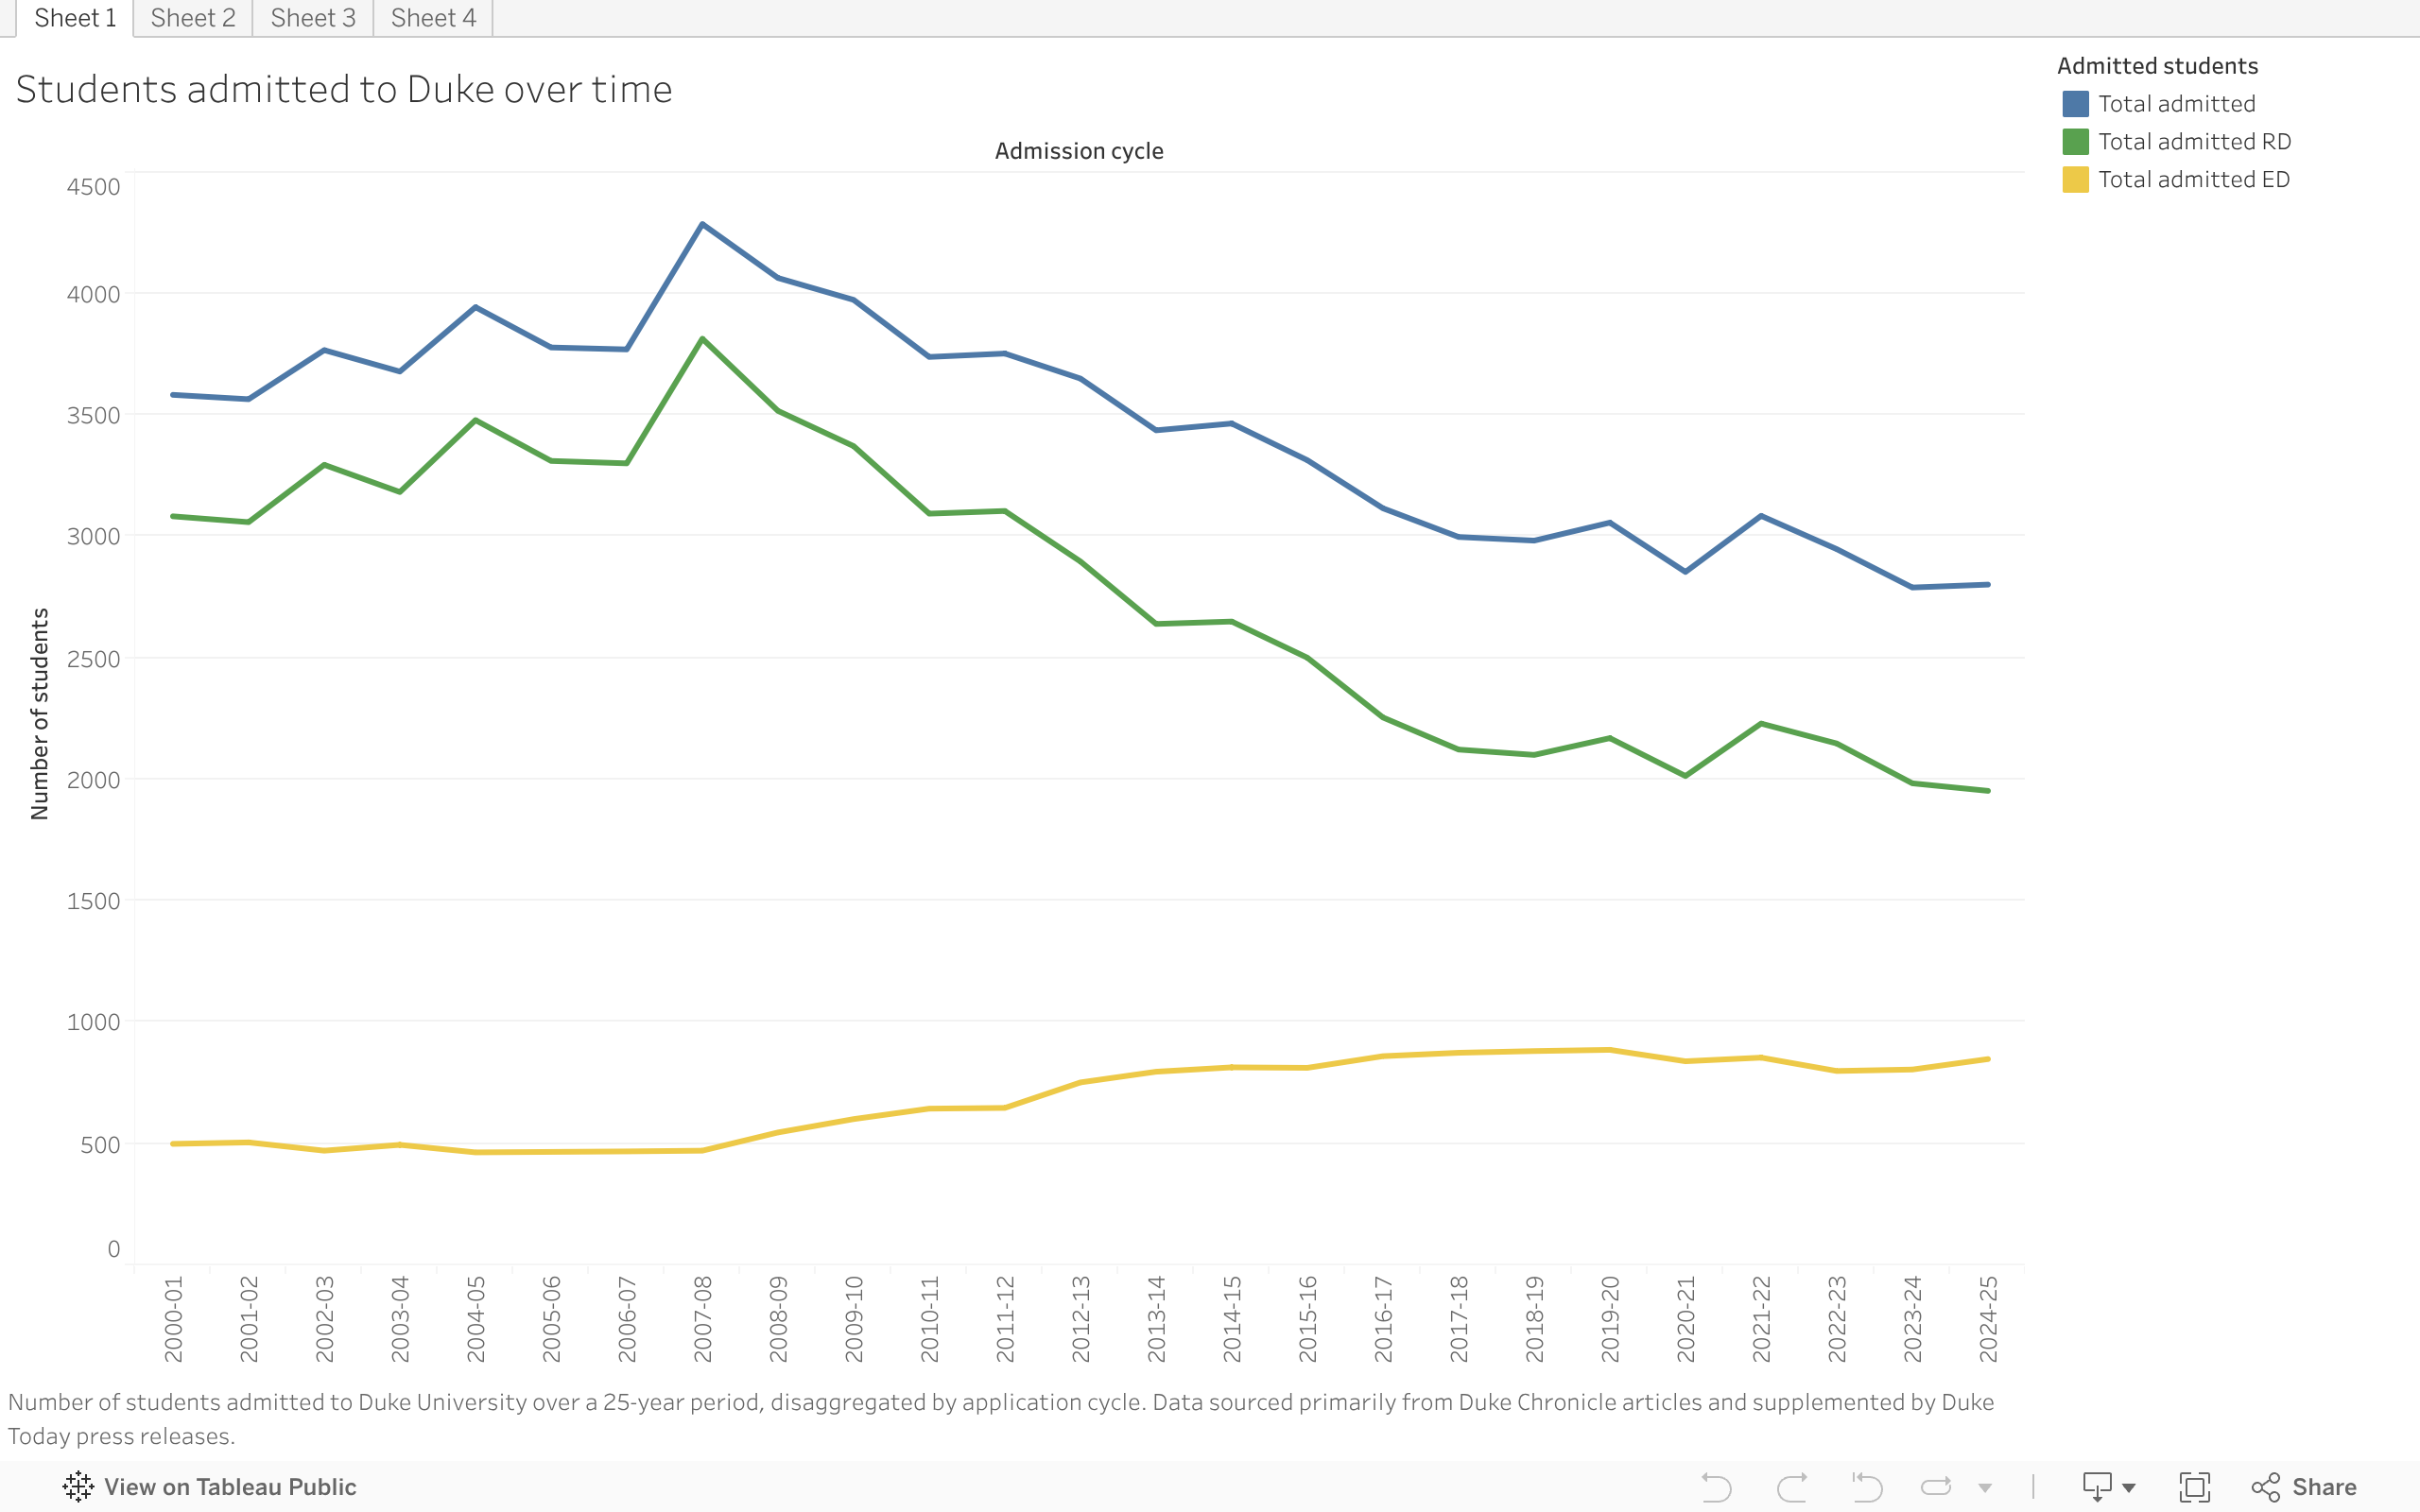
2004-05 saw the fewest students accepted Early Decision at 465, while 2019-20 saw the most at 887.
Meanwhile, Regular Decision students were accepted at a roughly increasing rate until peaking in 2007-08 at 3,814. Afterward, Regular Decision acceptances steadily declined, dropping below 2,000 for the first time in 2023-24.
Methods and limitations
The dataset uses reported totals for applications received and applicants admitted to the University during both the Early Decision and Regular Decision cycles. Overall totals across the full application period were calculated by summing these values. Acceptance rates for all three categories were calculated using those values and may differ from reported rates, likely due to rounding differences.
Additionally, in some years, Duke has included students who were deferred Early Decision but accepted during the Regular Decision review period in its Regular Decision acceptance rate. But in other years, these students were recorded separately. Thus, some variability in Regular Decision acceptance rates over time can be attributed to this inconsistent methodology.
There were two years during which Duke did not disclose exact admission figures. In 2015, the University reported that total applications surpassed 31,150 and that “more than 28,000” students applied during the Regular Decision cycle but did not provide exact counts. Similarly, in 2017, Duke reported receiving “more than 34,400” total applications and “almost 31,000” Regular Decision applications. In both cycles, however, the University did report the exact number of Early Decision applicants. The Chronicle articles from these years do not provide more detail; thus, the dataset includes these rough estimates, meaning that figures for those years are less precise.
Finally, the University did not report the number of applications it received during the respective 2006-07 Early Decision and Regular Decision rounds, only the total number of applications received throughout the full admission cycle: 19,170. The Chronicle reported that Early Decision applications decreased by 20% from 2005 to 2006 — which Dean of Undergraduate Admissions Christoph Guttentag attributed at the time to negative media coverage of the University amid the Duke lacrosse case — so the number of Early Decision applications is estimated in The Chronicle’s dataset at 1,200. The number of Regular Decision applications is estimated at 17,970, calculated by subtracting the estimated Early Decision value from the reported total value.

Zoe Kolenovsky is a Trinity junior and news editor of The Chronicle's 120th volume.