Editor's note: This story is part of a series based on a survey of Duke faculty conducted by The Chronicle April 8 to 19. You can read more about our methodology and limitations here, or read all of our survey coverage here.
For its first year, The Chronicle surveyed Duke faculty members about their thoughts on contentious issues facing higher education, including affirmative action.
We found that faculty members generally opposed the SCOTUS ruling, although this varied by demographics, political identities and field of study. Faculty members who are conservative or agree with the ruling are less likely to believe campus discourse about affirmative action is healthy and are less comfortable discussing the issue with other Duke community members.
The overturning of affirmative action
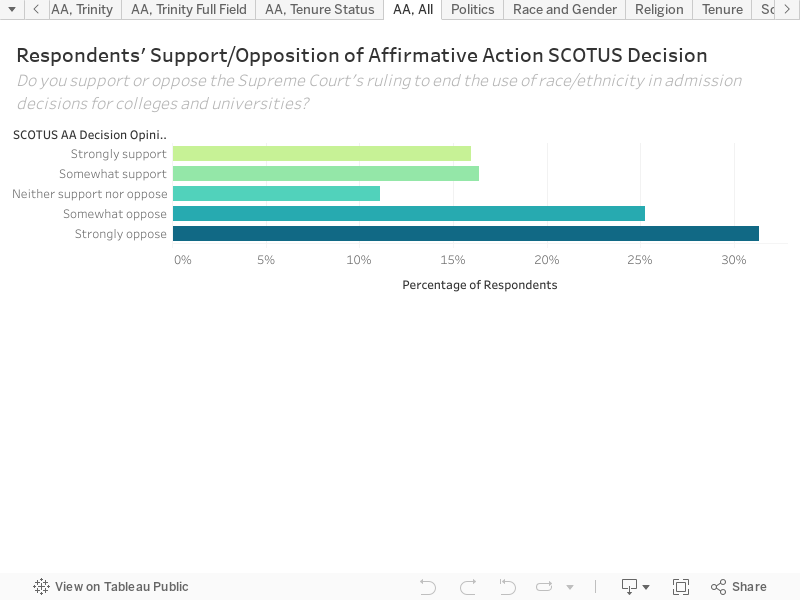
We asked faculty members whether they supported or opposed the Supreme Court’s ruling to end the use of race and ethnicity in admission decisions for colleges and universities.
In the 6-3 decision, Chief Justice John Roberts wrote that students must be treated based on their experiences as individuals and not on the basis of race. Duke filed an amicus brief alongside 14 other highly-ranked institutions in support of Harvard University and the University of North Carolina at Chapel Hill, the two schools challenged by anti-affirmative action nonprofit Students for Fair Admissions in the original lawsuit.
The ruling forced undergraduate colleges and universities across the United States — including Duke — to alter their admissions practices. It still permits universities to consider an “applicant’s discussion of how race affected [their] life, so long as that discussion is concretely tied to a quality of character or unique ability that the particular applicant can contribute to the university.” President Vincent Price wrote at the time that the University’s position “continues to be that diversity is absolutely vital to our educational mission.”
Experts predicted at the time that the decision would increase the proportion of white and Asian students at elite institutions, but data for Duke’s Class of 2028 — the first to be impacted by the ruling — saw declines in both percentages. SFFA sent a letter to the University in September saying it was “prepared to enforce” the decision against Duke “through litigation,” alleging that the class’ “racial numbers are not possible under true race neutrality.”
Duke faculty views on the decision
Faculty members generally opposed the Supreme Court decision.
A majority of respondents said they opposed the SCOTUS ruling. 31.31% of faculty members “strongly” opposed it while 25.26% “somewhat” opposed it. 11.08% neither supported nor opposed the ruling, 16.37% were “somewhat” in support and 15.98% “strongly” supported the ruling.
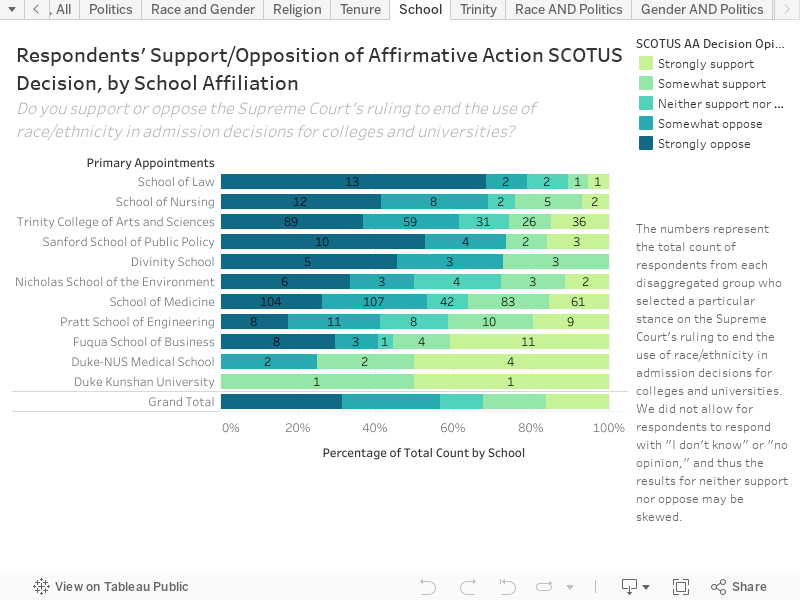
Among schools with at least 15 respondents, faculty respondents from the School of Law were most likely to oppose the decision (78.95%), while respondents from the Fuqua School of Business were least likely to (40.74%).
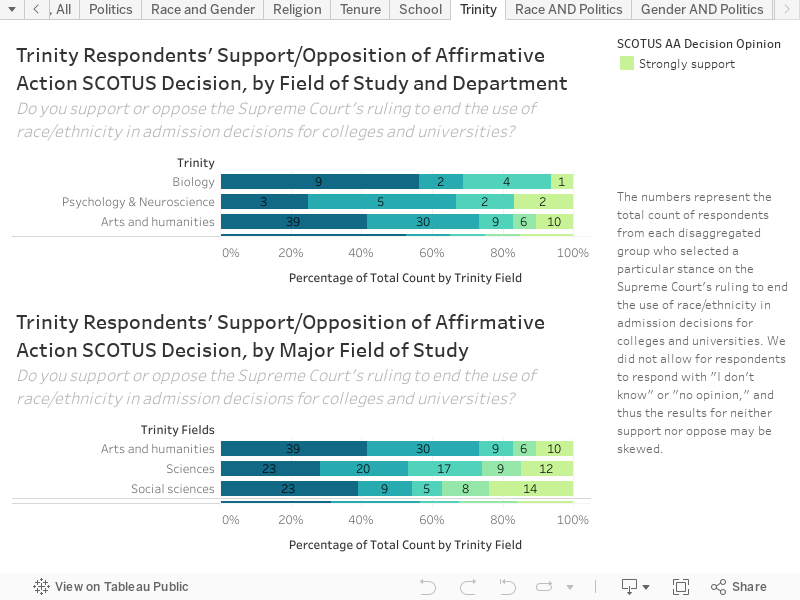
When grouped by three major fields of study, Trinity faculty respondents involved with arts and humanities were most likely to oppose the ruling (73.4%), and those affiliated with the sciences were least likely to oppose it (53.09%). Meanwhile, Trinity faculty respondents from the social sciences were most likely to support the ruling (37.29%), while faculty from the arts and humanities were least likely to support it (17.02%).
Notably, 12 out of the 22 social science respondents who supported the decision are from the economics department. When excluding economics, only 25% of social science faculty supported the decision.
Get The Chronicle straight to your inbox
Sign up for our weekly newsletter. Cancel at any time.
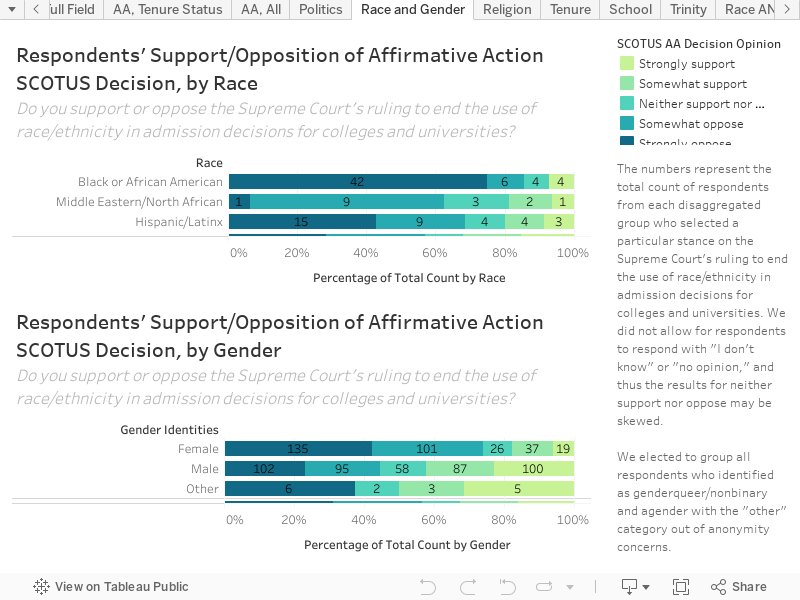
Support or opposition to the decision generally fell along political lines. Asian respondents were more likely to support the ruling, while Black or African American respondents were more likely to oppose it compared to other racial groups.
From most to least opposed to the decision among racial categories with more than 30 respondents, the order was: Black or African American (85.71%), Hispanic/Latinx (68.57%), white (56.86%) and Asian (42.39%). Meanwhile, male respondents tended to be more supportive of and less opposed to the decision compared to female respondents.
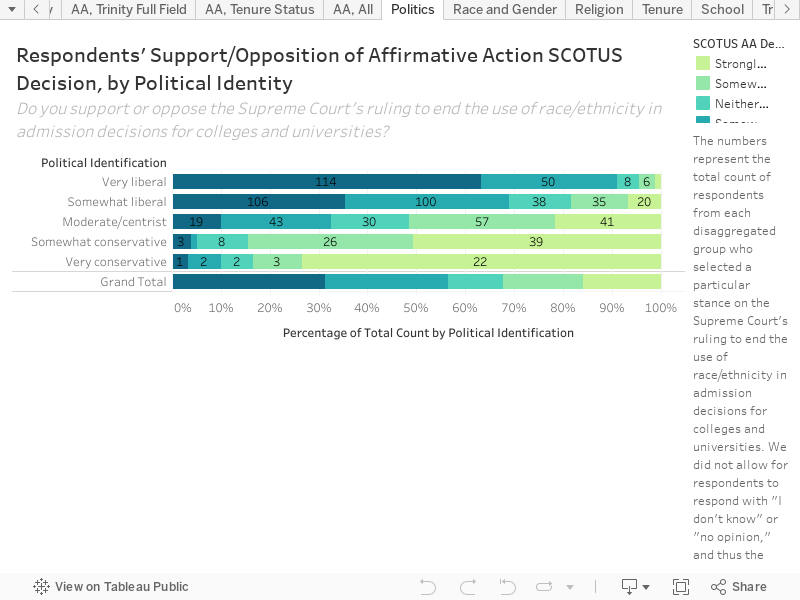
Opinions on the decision generally fell along political lines, with liberal respondents being more likely to oppose the decision compared to conservative respondents. About 4.44% of “very liberal” respondents supported the decision, as did 18.4% of “somewhat liberal” respondents, 51.58% of moderate or centrist respondents, 84.42% of “somewhat conservative” respondents and 83.33% of “very conservative” respondents.
However, certain demographic identities are closely correlated with political affiliations, both nationwide and in our poll. For example, female and Black respondents are more likely to identify as liberal compared to male and white respondents. We further disaggregated the data by political identity for a deeper analysis.
Within each racial group, moderates and conservatives were generally more likely to support the Supreme Court’s decision. The exception was Black or African American respondents, likely because only 3 out of the 56 Black respondents self-identified as conservatives.
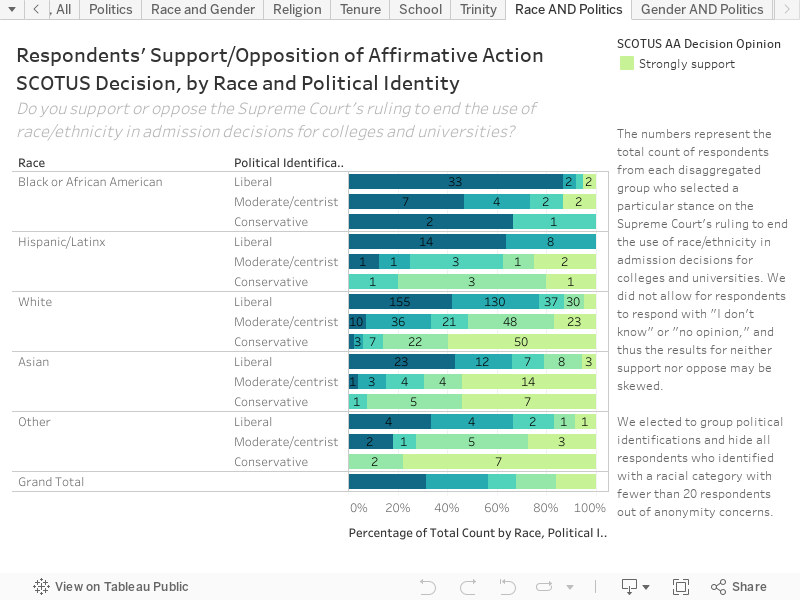
Furthermore, liberal faculty members within each racial group were significantly less likely than moderates to support the decision. Only 5.26% of Black liberal faculty members supported it, along with 12.74% of white liberals, 20.75% of Asian liberals and 16.66% of those identifying with another category. No Hispanic/Latinx liberal faculty members supported the decision.
In contrast, 13.33% of Black moderate faculty members supported it, along with 37.5% of Hispanic/Latinx moderates, 51.45% of white moderates, 69.23% of Asian moderates and 72.72% of moderates identifying with another race. These results are likely influenced by low response counts in certain categories — for instance, there are only eight Hispanic/Latinx moderates.
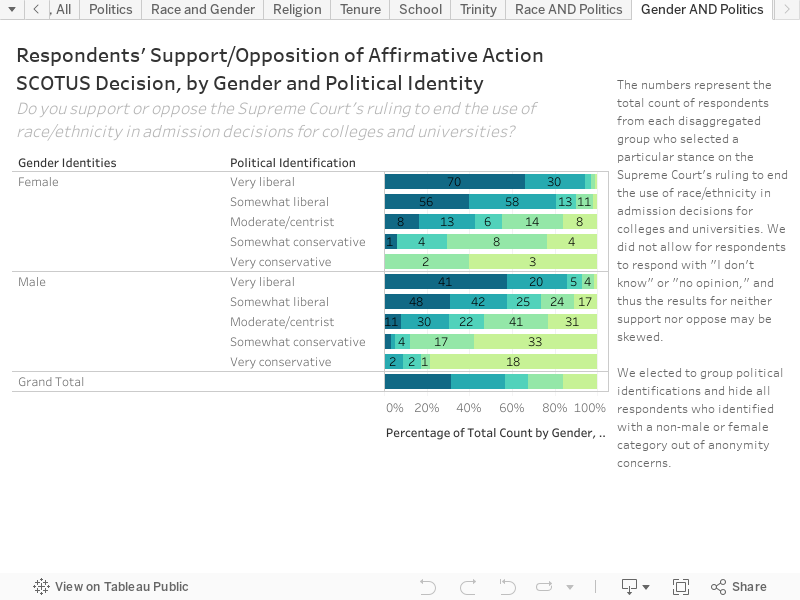
When further disaggregated by political identity, male respondents remained more likely than female respondents to support the ruling, although the gap between the two groups was less pronounced among those who identified as very liberal or moderate.
You can view disaggregation by religion and tenure status on Tableau.
Comparison with national polls
The opinions expressed by Duke faculty members do not seem to reflect the sentiment of Americans overall. A January survey of Americans by the Gallup Center on Black Voices found that approximately 68% of respondents thought the SCOTUS ruling was “mostly a good thing.” When disaggregated by race, the majorities of Black, Asian, white and Hispanic respondents viewed the ruling positively.
Gallup found that Black adults were the least likely to support the ruling, which aligns with the results from Duke faculty. However, 52% of Black Gallup respondents said that the decision was “a good thing,” compared to only 14.28% of Black faculty respondents at Duke who supported the ruling. Gallup also found that white adults (72%) were more likely than Asian adults (63%) to support the ruling, whereas the opposite was true among Duke faculty.
Range of views on campus
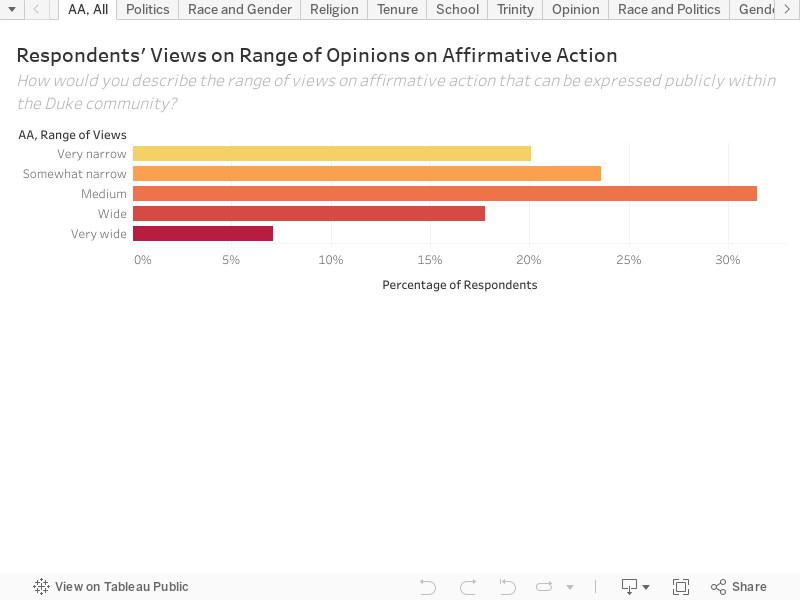
We asked faculty members how they would describe the range of views on affirmative action that can be expressed publicly within the Duke community. Respondents could either answer whether they thought the range was very wide, wide, medium, somewhat narrow or very narrow.
A plurality of respondents — 31.44% — said they thought the range was medium. 20.1% of respondents thought it was very narrow, 23.58% thought it was somewhat narrow, 17.78% thought it was wide and 7.09% thought it was very wide.
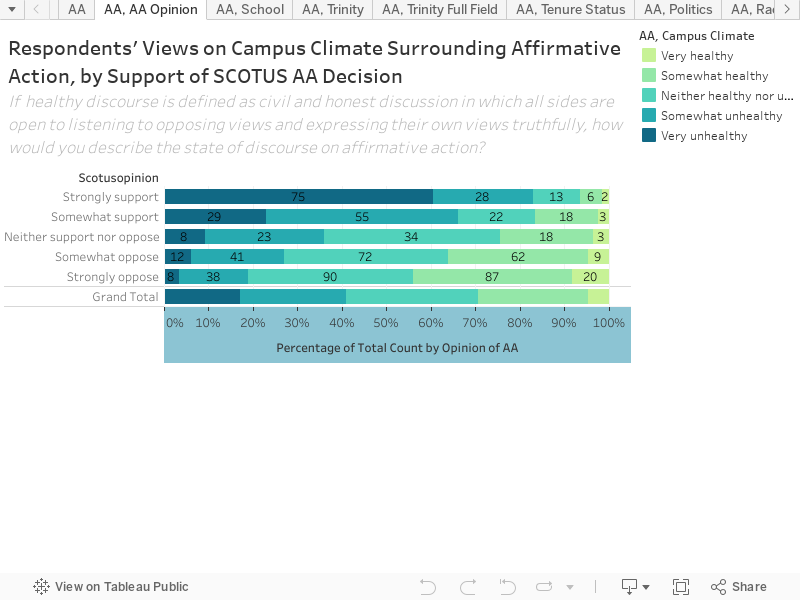
Faculty that supported the SCOTUS decision tended to characterize the state of discourse on campus surrounding affirmative action as unhealthy, while those that opposed the decision were more likely to view the state of campus discourse as healthy.
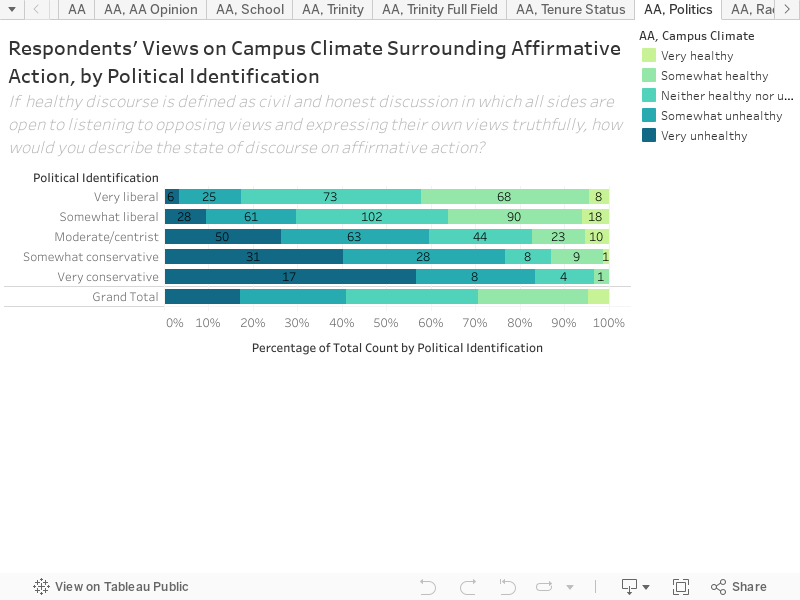
Views on the state of campus discourse surrounding affirmative action also aligned with political identification. Respondents who self-identified as conservative were more likely to say that the state of discourse on affirmative action was unhealthy, while those who identified as liberal were more likely to say that the state of discourse on affirmative action was healthy.
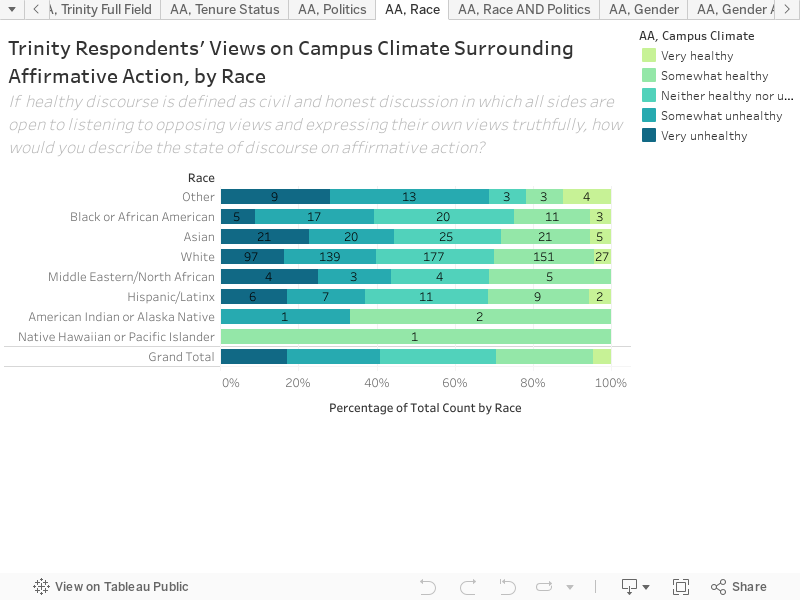
Among racial identities with more than 30 respondents, Asian faculty were most likely to say that the state of discourse on affirmative action was unhealthy, while Hispanic/Latinx faculty members were the least likely to say so. Hispanic/Latinx faculty members were the most likely to say that the state of discourse on affirmative action was healthy, while Black faculty members were the least likely to say so.
You can view further disaggregations regarding the state of campus discourse on Tableau.
Comfort discussing affirmative action
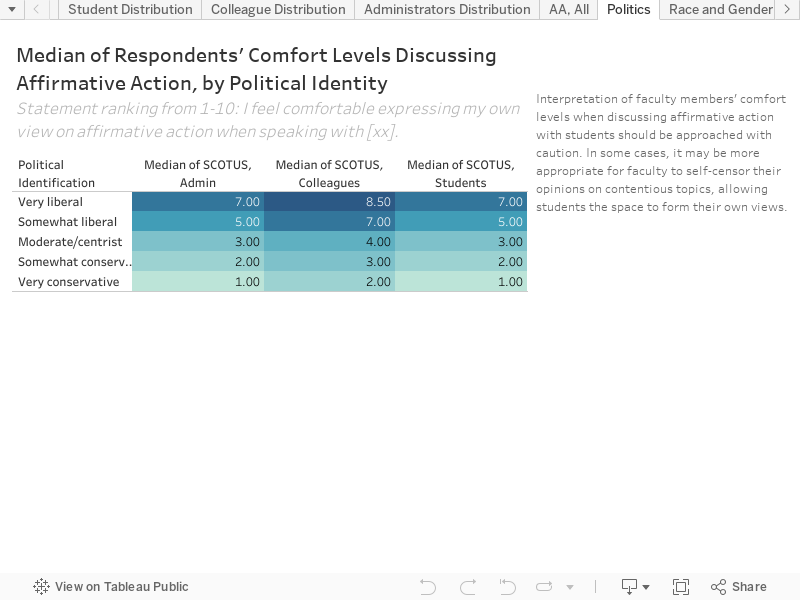
We asked faculty members to rank their comfort level expressing their opinions on affirmative action with administrators, colleagues and students, each on a scale of 1 to 10. A rating of 1 represented “not comfortable at all,” while a rating of 10 represented “extremely comfortable.”
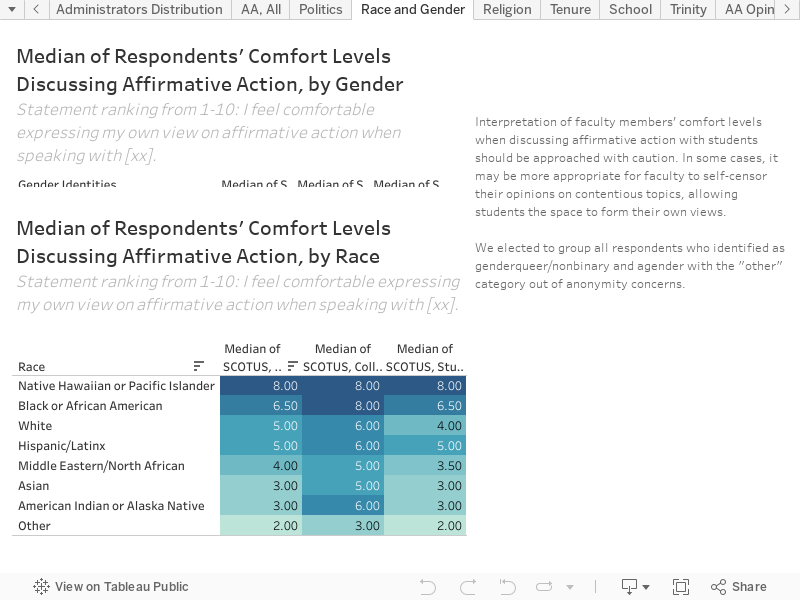
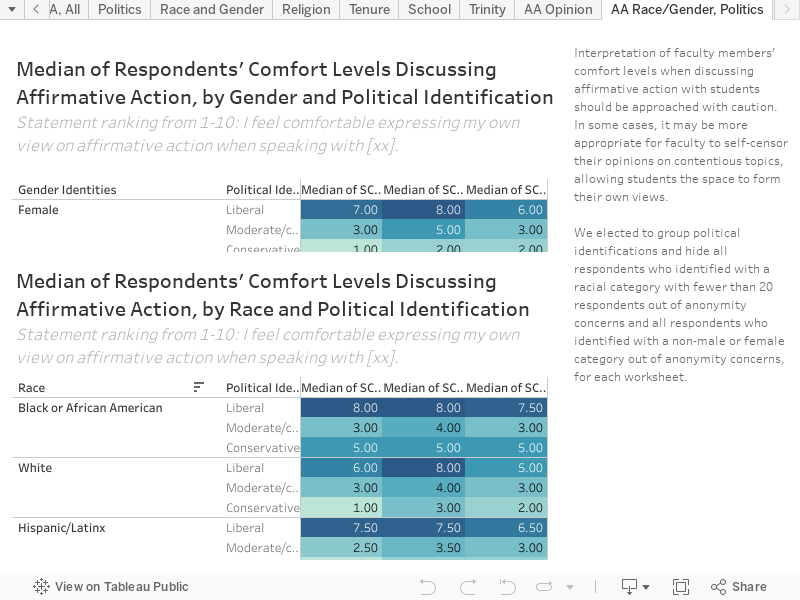
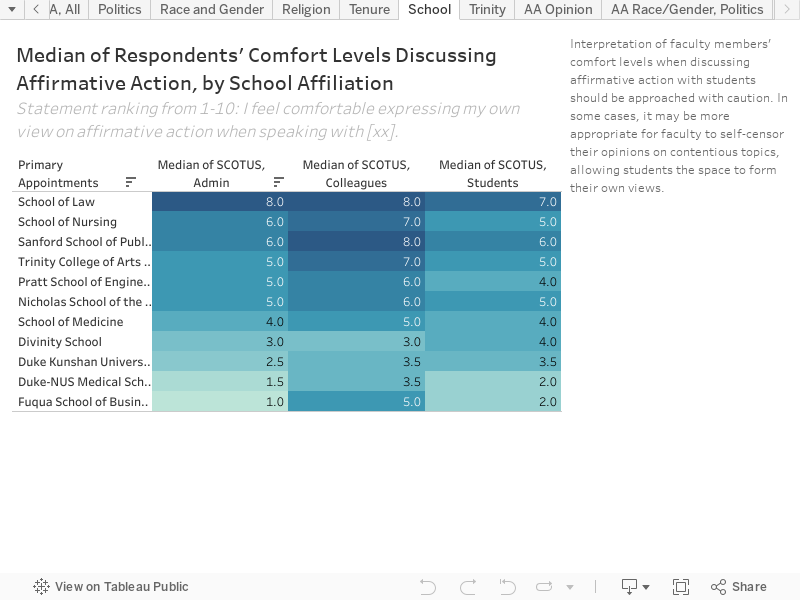
Interpretation of faculty members’ comfort levels when discussing affirmative action with students should be approached with caution. In some cases, it may be more appropriate for faculty to self-censor their opinions on contentious topics, allowing students the space to form their own views.
The mean rating for faculty members was 4.86 when speaking with administrators, 5.77 when speaking with colleagues and 4.68 when speaking with students. The median rating for faculty members was 5 when speaking with administrators, 6 when speaking with colleagues and 4.5 when speaking with students.
A distribution of faculty responses regarding their comfort level in expressing their opinions on affirmative action with students, colleagues and administrators can be viewed on Tableau.
Respondents who supported the decision generally felt the least comfortable discussing the topic with any of the three parties. Liberal faculty members reported feeling more comfortable discussing affirmative action across all groups compared to conservative faculty members, and female faculty members were more comfortable than male faculty members in these discussions, even when further disaggregated by political identification.
Among racial identities with more than 30 respondents, Black or African American faculty members were the most comfortable discussing affirmative action across all groups, while white and Hispanic/Latinx respondents reported similar mid-range levels of comfort. Asian faculty members were the least comfortable discussing the topic.
When further disaggregated by political identity, liberal respondents generally felt more comfortable discussing affirmative action than moderate or conservative respondents. The overall patterns remained consistent across racial groups — Black faculty were the most comfortable, Hispanic/Latinx respondents reported similar levels to white respondents, and Asian faculty members were the least comfortable. Asian conservatives were more comfortable discussing affirmative action than either Hispanic/Latinx or white conservatives.
Among schools with at least 15 respondents, respondents from the School of Law felt the most comfortable discussing affirmative action with all groups, while those from the Fuqua School of Business were the least comfortable discussing the subject with administrators and students. This may be related to the fact that Law School faculty were the most likely to oppose the decision, whereas Fuqua faculty were the least likely to oppose it. Respondents in the Divinity School were the least comfortable discussing the subject with colleagues.
When grouped by three major fields of study, Trinity faculty affiliated with the arts and humanities were more comfortable speaking with colleagues about affirmative action, followed by the sciences and social sciences.
You can find disaggregations by tenure status and religion here.
Differing representations of opinions on affirmative action
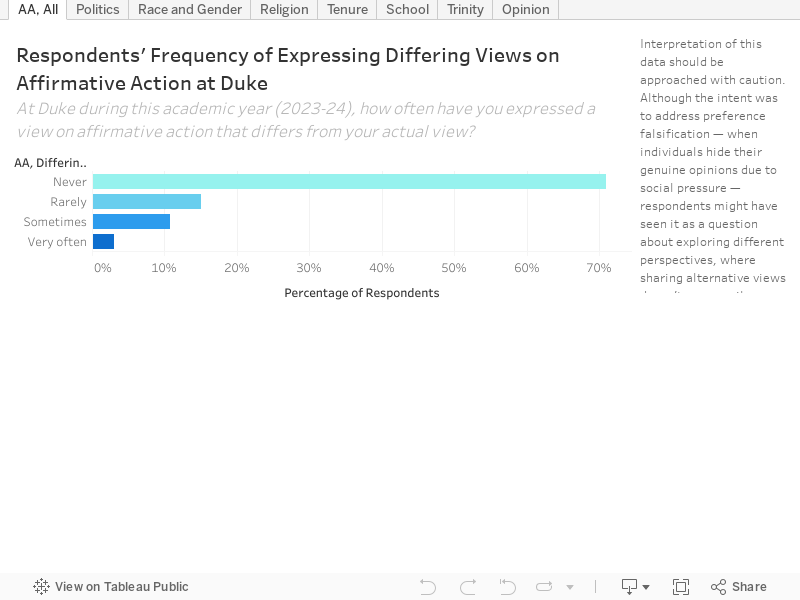
We also asked faculty members how often they expressed a view on affirmative action that differed from their actual view during the 2023-24 academic year.
However, the interpretation of this question should be taken with caution, as the phrasing may have inadvertently introduced ambiguity, potentially influencing the reliability and validity of the data. Although the intent was to address preference falsification — when individuals hide their genuine opinions due to social pressure — respondents might have seen it as a question about exploring different perspectives, where sharing alternative views doesn’t necessarily mean hiding their actual beliefs.
About 71.01% of respondents “never” expressed a differing view, 15.08% did so “rarely,” 10.82% did so “sometimes” and 3.09% did so “very often.
You can view additional disaggregations by race; gender; religion; opinion on affirmative action; political leanings; tenure status; school affiliation and Trinity field here.

Michael Austin is a Trinity junior and managing editor of The Chronicle's 120th volume.

Jazper Lu is a Trinity senior and centennial/elections editor for The Chronicle's 120th volume. He was previously managing editor for Volume 119.